Wednesday, 04 March, 2020
Monitoring stability and performance with metrics
 Jeremy Taylor
 In the 1.7 release we have included support for various metrics.
These metrics give you information such as: how long your queries are taking, the rate at which documents are being ingested, and how large your node’s local indexes have grown (amongst other things).
In the first release of this feature we have included metrics for several key components:
-
Query engine
-
Indexer
-
RocksDB
Dropwizard’s metrics library is used to create a registry instance that is passed around to various reporters that may expose the inner metrics of the live system. Currently we support 5 monitoring approaches for consuming these metrics:
-
Console output
-
CSV files
-
Prometheus Exporter & HTTP Reporter
We’ve made instrumenting new and existing modules with additional metrics very straightforward. Below is
an example node with a RocksDB backend which displays Prometheus metrics to the
default port 8080. RocksDB metrics have also been included here with the
kv-store item in the topology map.
(xt/start-node
{:xtdb.metrics.prometheus/reporter {:push-gateway "http://localhost:9091"}
:xtdb/index-store {:kv-store {:xtdb/module 'xtdb.rocksdb/->kv-store
:metrics {:xtdb/module 'xtdb.rocksdb.metrics/->metrics}}
:xtdb/document-store {...}
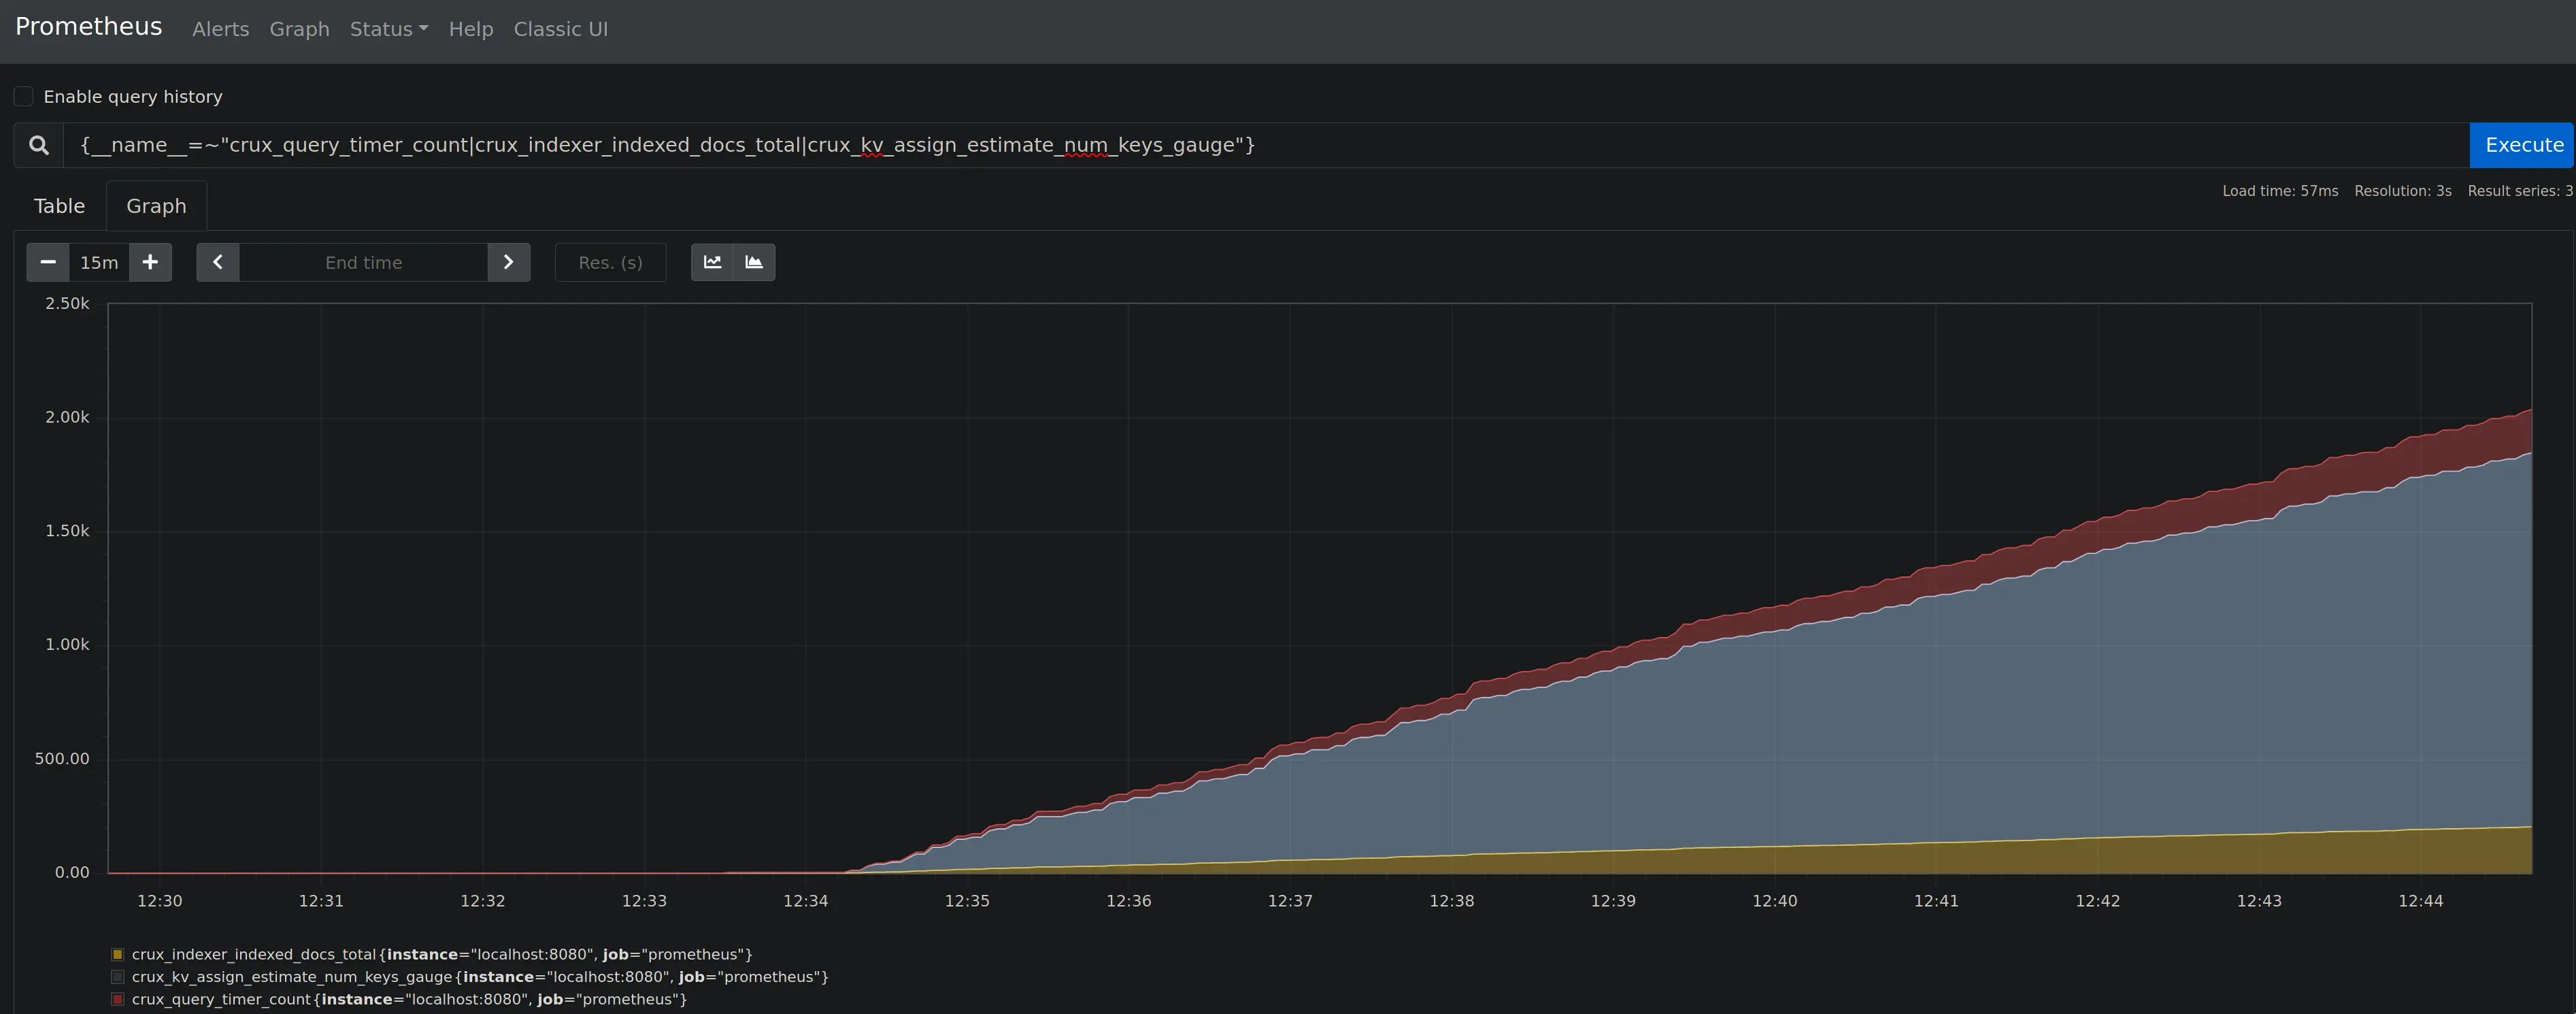
:xtdb/tx-log {...}}})As soon as you’ve pointed at this endpoint in your Prometheus config you’re all set and should quickly find yourself looking at some interesting graphs:
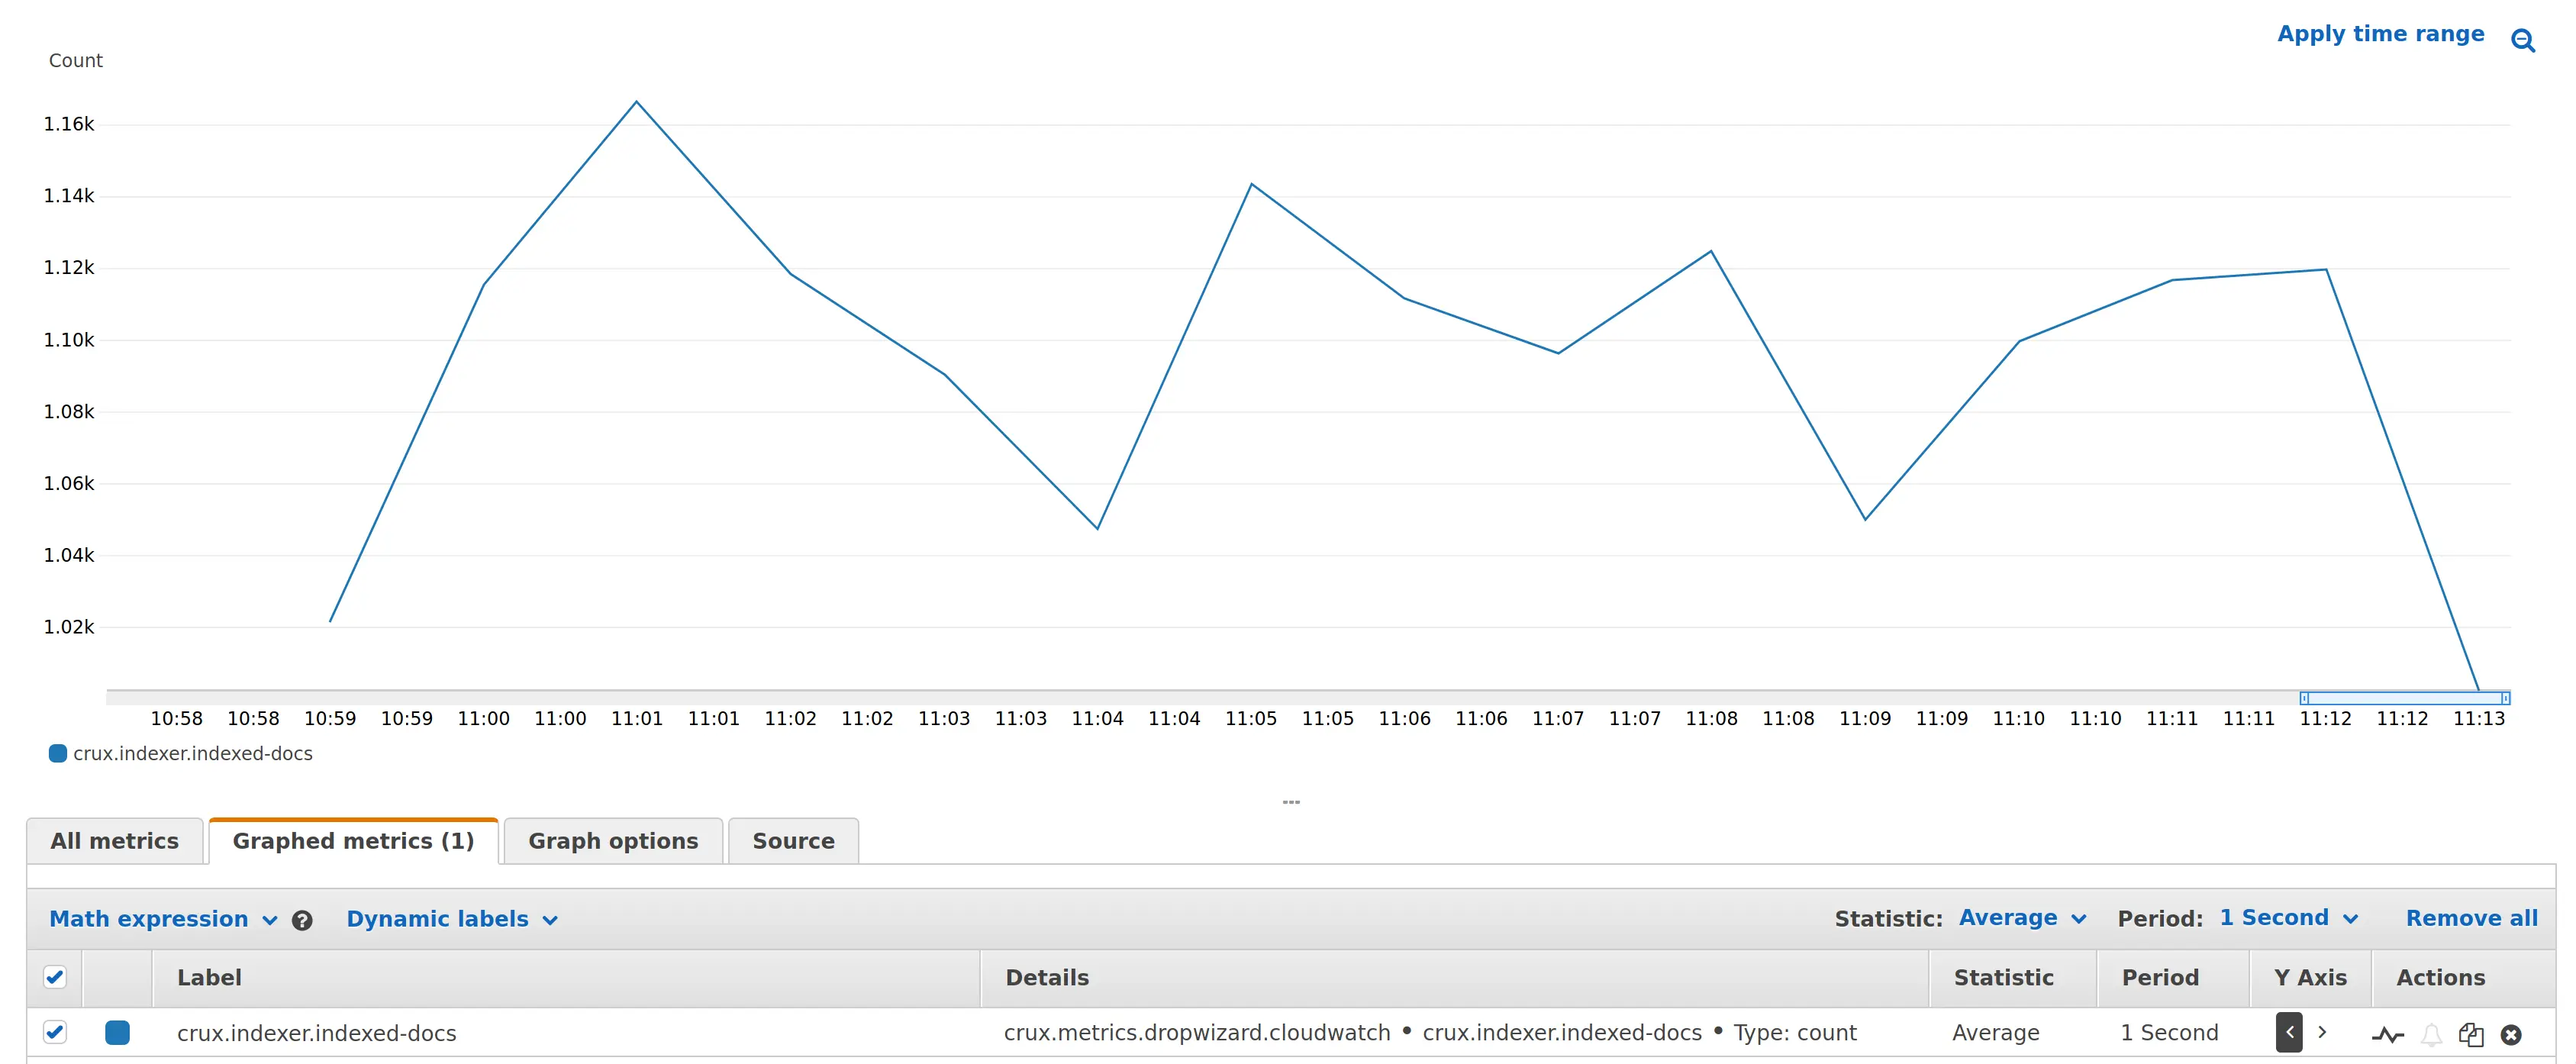
Getting set-up with Cloudwatch is just as easy.
When run on ECS the AWS api is able to detect the relevant credentials to upload metrics to cloudwatch. If running locally we also provide options to specify the desired region to upload and also to provide valid credentials.
In the most recent XTDB showcase we demonstrated this in action working with our new benchmark environment running on AWS (Skip to 11 mins for metrics).
(Because of the immutable nature of YouTube videos, you’ll note XTDB is still referred to as "Crux" in the video and the title.)
For more configurations and options take a look at the Monitoring documentation.
If you need any help, give us a shout!